Data Center Opposition Is Technology Specific: What 3,142 Counties Say About Data Centers, Solar and Battery Storage
Across 3,142 counties, data center resistance rarely extends to solar or storage, suggesting residents distinguish

Press Release Disclaimer: This is a press release distributed through the XPR Media network. It has not been independently verified by our newsroom.
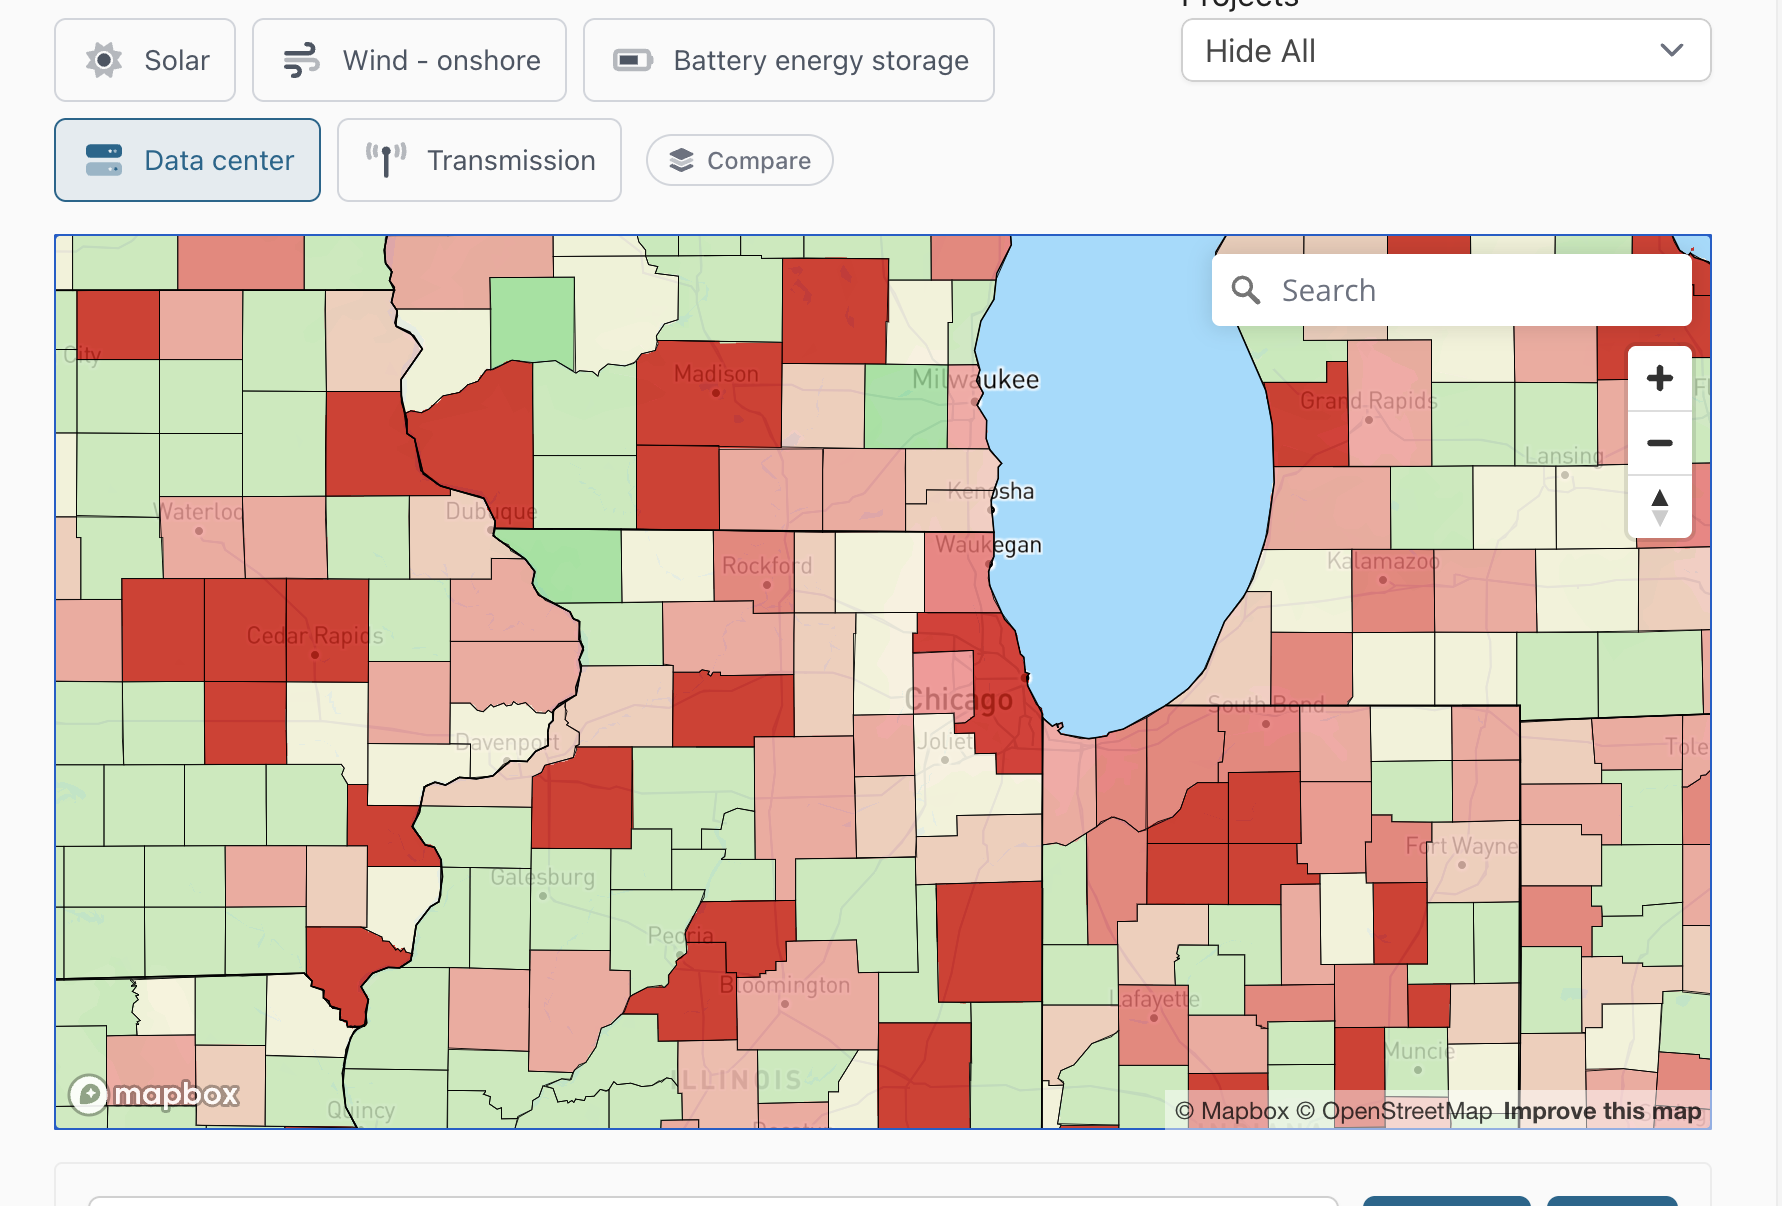

Across 3,142 counties, data center resistance rarely extends to solar or storage, suggesting residents distinguish technologies rather than reject development
PORTLAND, OR, UNITED STATES, September 16, 2026 /EINPresswire.com/ — Learnewable‘s September local sentiment and permitting conditions analysis rates solar, battery storage and data-center feasibility across 3,142 U.S. counties on a −2 to +2 scale. Comparing technologies within each county shows that opposition to data centers generally does not extend to solar or storage.
Restrictions rarely overlap.
Thirteen counties (0.4%) have enacted prohibitions or moratoria on all three technologies, and 48 rate unfavorable for all three. By contrast, 282 restrict data centers alone. Of the 802 counties unfavorable for data centers, 578 (72%) are neutral or better for both solar and storage, and 115 are favorable for at least one. Correlations between technology scores range from 0.2 to 0.3: a county’s position on one is a weak predictor of its position on another.
Community sentiment follows the same pattern.
Among 974 counties with negative data-center sentiment, 58% have positive sentiment toward solar and 74% toward storage. Nearly half (49%) are positive toward both.
Existing data centers are associated with opposition to new data centers.
In counties hosting ten or more operating facilities, 66% have negative sentiment toward new data centers. Twenty-nine percent have the most unfavorable sentiment rating—roughly three times the share in counties with no facilities (9%). Solar and storage sentiment in those same counties (+0.49 and +0.65) is statistically indistinguishable from counties without data centers (+0.47 and +0.76).
Data-center opposition increases with population.
Negative sentiment rises from 13% of counties in the least-populous quartile to 55% in the most populous, while average sentiment falls from +0.18 to −0.49. The increase is smaller for solar (12% to 29%) and storage (4% to 14%). Counties with a data-center-specific backlash have a median population near 60,000, versus 26,000 nationally, and are nearly twice as likely to host a facility (20% versus 11%).
State averages differ by technology.
Twenty-one states with at least ten counties average positive for solar and storage but negative for data centers. Florida shows the largest split: +0.27 for solar, +0.30 for storage and −0.84 for data centers; 30% of its counties restrict data centers. New Jersey (+0.48, +0.42 and −0.63, respectively), North Carolina, Georgia, South Carolina and Pennsylvania follow the same pattern.
The Northeast averages −0.75 for data centers, with restrictions in 34% of counties, compared with −0.02 for solar and +0.09 for storage. Twelve states average positive for data centers, all in the low-density interior and Deep South: West Virginia, Mississippi, Idaho, Alaska, Louisiana, Montana, South Dakota, Oklahoma, Alabama, Arkansas, North Dakota and Nebraska.
Storage is the most accepted technology in every region.
It has the highest national feasibility average (+0.23), the lowest restriction rate (2.2%) and negative sentiment in fewer than 10% of counties. Storage ranks first, followed by solar and data centers, across the Northeast, Midwest, South and West.
What this means for developers.
For data centers, 363 counties combine supportive sentiment with restrictive zoning, concentrated in Georgia, Iowa, Kentucky, Tennessee and Kansas. In these jurisdictions, zoning rules are the main barrier, making ordinance changes central to feasibility.
For solar and storage developers, data-center opposition does not indicate broad resistance to development. In most counties where that opposition is strongest, solar and storage feasibility remains neutral or favorable.
What this means for local residents.
These findings suggest that concerns about a proposed data center can be specific to that project without reflecting opposition to development generally. Residents can ask for clear, project-specific information on electricity demand, water use, noise, tax incentives and local benefits. County averages provide context, but each proposal deserves evaluation on its own merits.
Dickens County, Texas, is the only county rated favorable for all three technologies this month.
Jeremy Solomon
Learnewable LLC
+1 503-575-8365
jeremy.solomon@learnewable.com
Visit us on social media:
LinkedIn
Legal Disclaimer:
EIN Presswire provides this news content “as is” without warranty of any kind. We do not accept any responsibility or liability
for the accuracy, content, images, videos, licenses, completeness, legality, or reliability of the information contained in this
article. If you have any complaints or copyright issues related to this article, kindly contact the author above.

Media gallery